In 2023 an air quality sensor node measuring Particulate Matter 2.5 (PM2.5) and nitrogen dioxide in the air was installed outside the Science Museum by scientists from Imperial as part of the Mayor of London’s Breathe London Community Programme.
How is the programme helping Londoners?
The Breathe London community programme is a pioneering project to involve people more directly in both monitoring local air quality and taking action. It’s in its third year now and we have given out 60 air quality sensors to amazing community groups to install outside their buildings across London.
We’ve been absolutely bowled over by the response. Meeting people in their community and listening to the passion they have for improving their local area is such a privilege. I think community monitoring is absolutely part of the future of environmental monitoring and management.

There are many different air pollutants. Why did Imperial choose for these air quality nodes to measure PM2.5 and nitrogen dioxide pollutants in particular?
Both of these are pollutants known to be harmful to health for many decades and there are legal limits set for the levels that can be in the air.
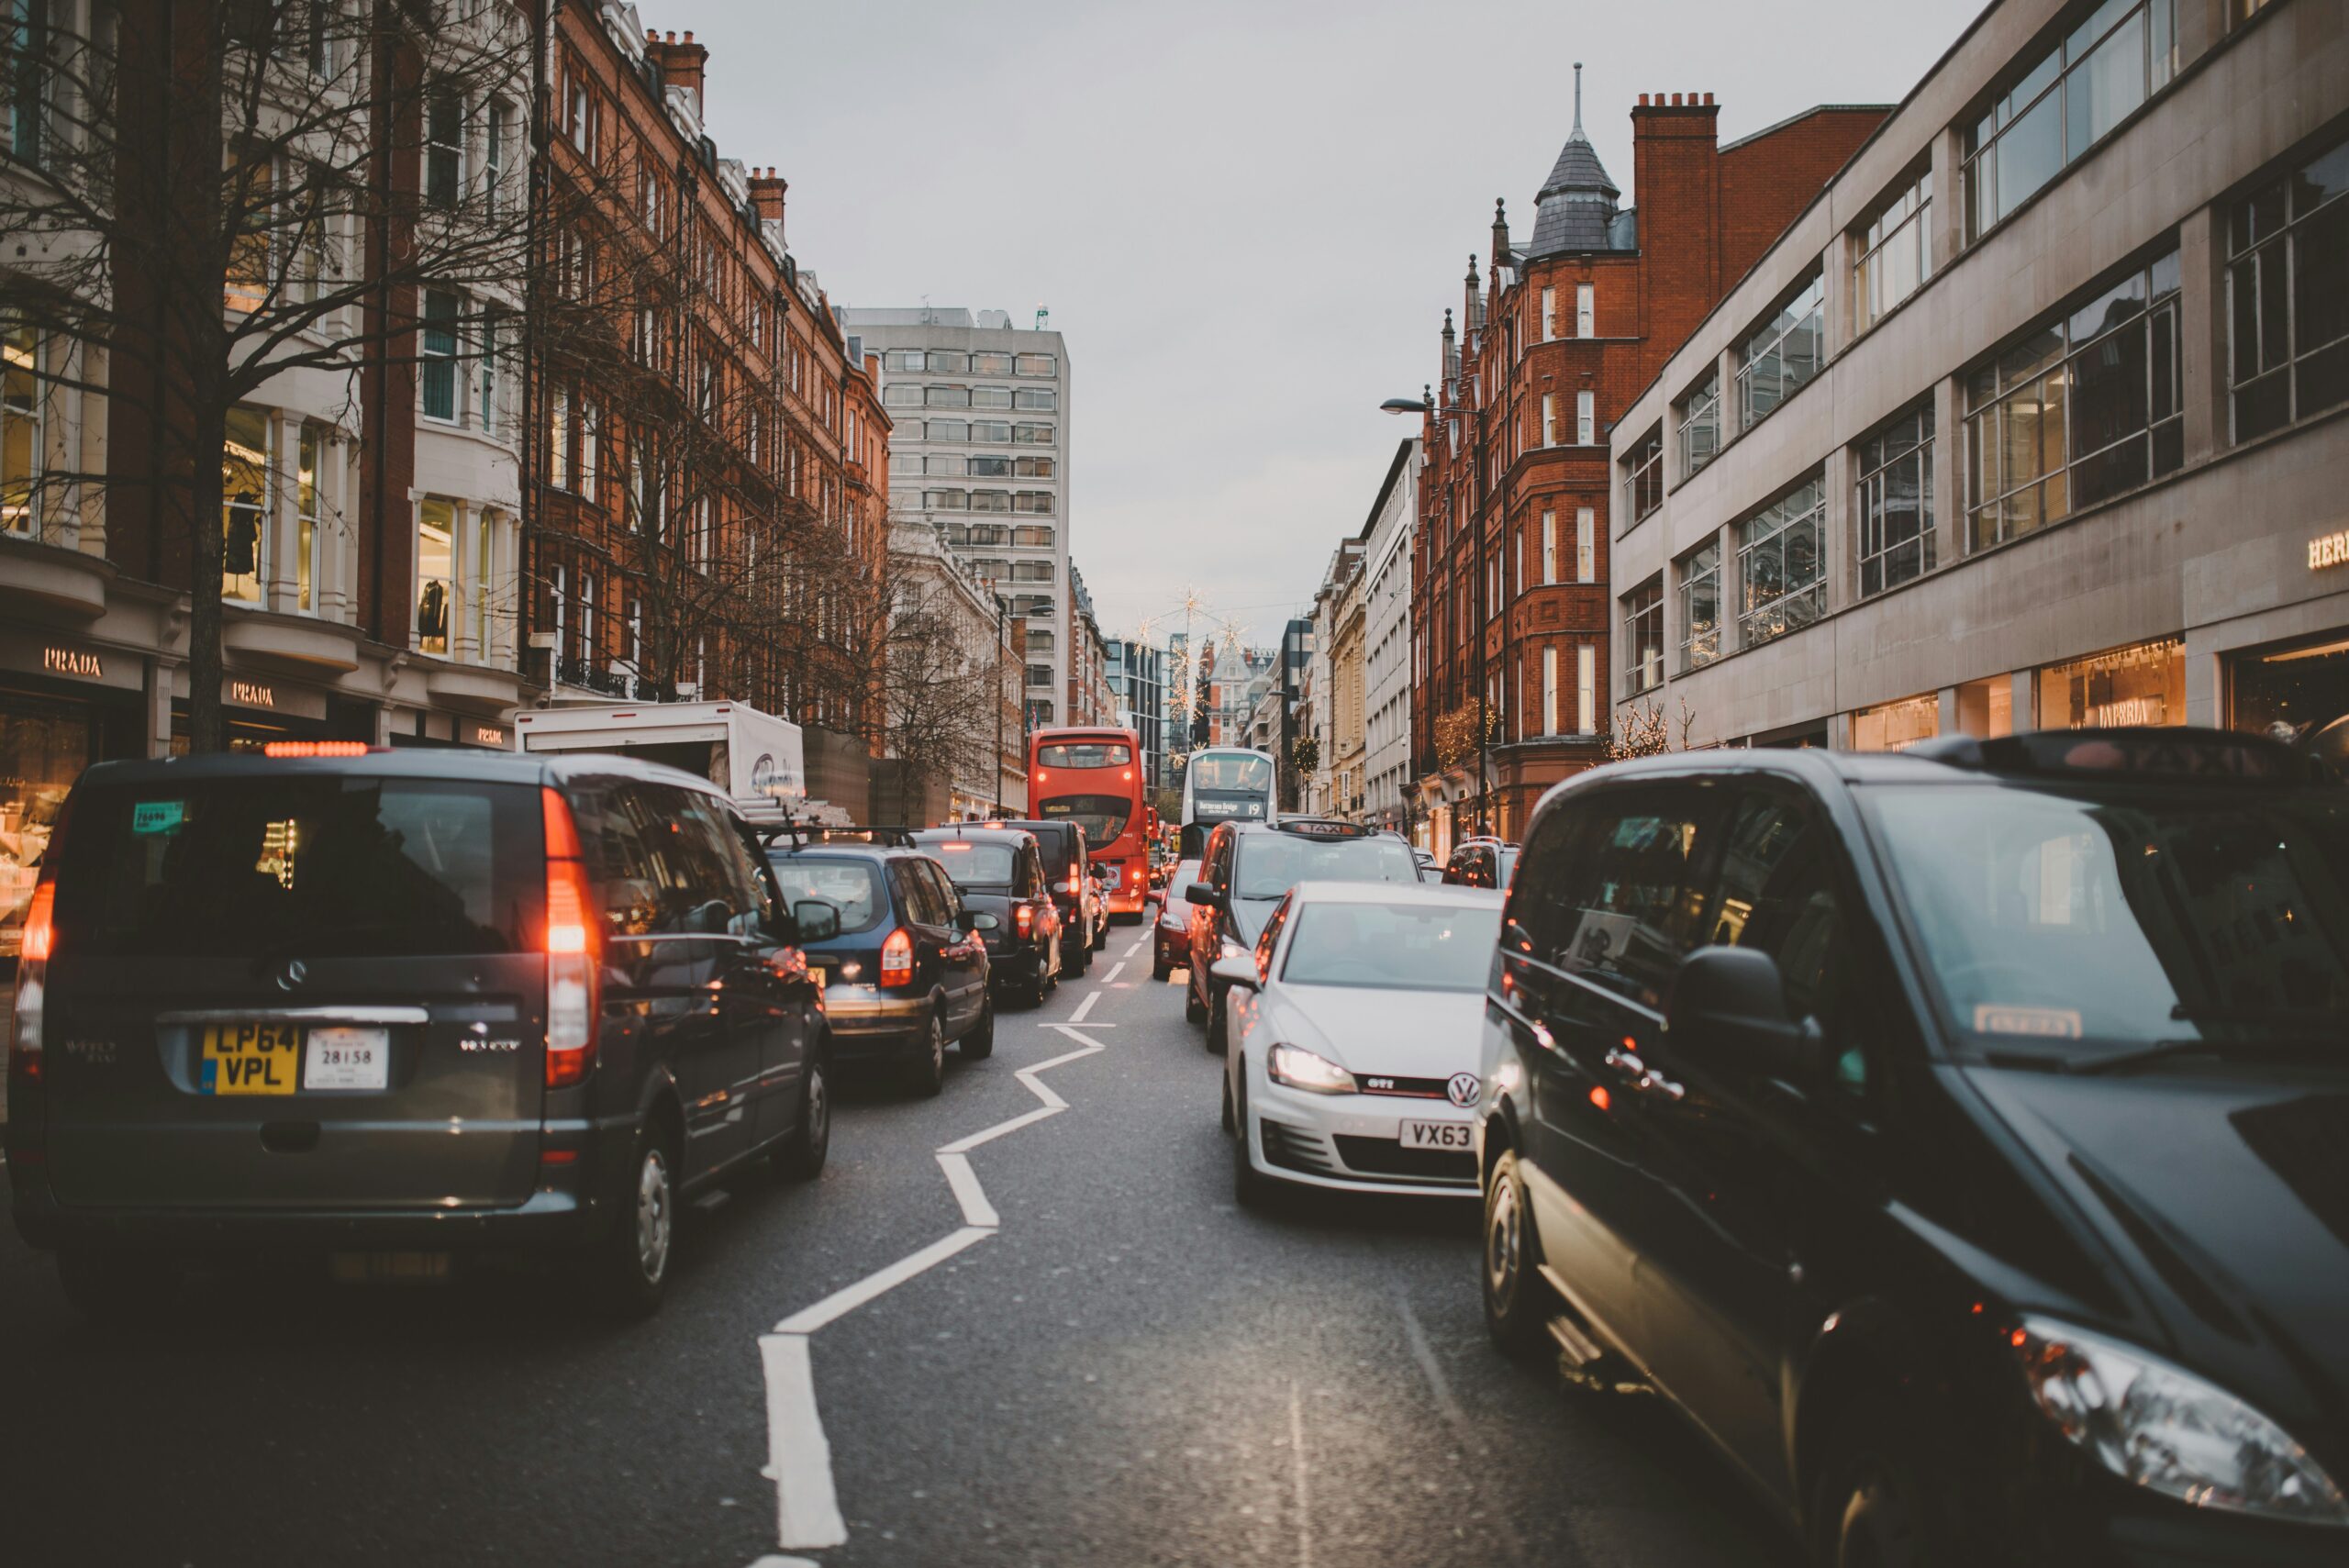
In London, most recent estimates show that 44% of the nitrogen dioxide in the air is from traffic. On very polluted days this gas can cause breathing difficulties for people with existing conditions such as asthma and Chronic Obstructive Pulmonary Disease (COPD). But it has also been shown to affect humans over the long-term including organ and adverse neurodevelopment during pregnancy, new onset asthma in children and lung function decline in older adults.
In London about 30% of PM2.5 is derived from cars, buses and lorries, 17% comes from domestic wood burning (17%) and 15% from commercial cooking. The small size of these particles means that they can enter the bloodstream and have serious health effects, including increasing the risk of lung cancer, heart disease, asthma and low birth weight.
What are the legal limits for both of these pollutants and how does that compare with levels across London?
For nitrogen dioxide the UK legal limit is 40 microgrammes per metre cubed of air, written as 40 ug/m3. The World Health Organization (WHO) also sets air pollution health guidelines and released new guidelines at the end of 2021, which set the recommendation for this pollutant at just 10 ug/m3 – significantly lower than the current UK limit.
We still have many roads in London where the annual mean is above the 40 ug/m3 legal limit and you can see a map of modelled annual mean Nitrogen dioxide air pollution across roads in London in 2016 from data taken from the London Atmospheric Emissions Inventory, compared to the UK and WHO guidelines here.
For PM2.5 particulates, the current UK annual limit is 20 ug/m3. Again, the WHO in their latest guidelines set the recommendation for this pollutant at just 5 ug/m3 as an annual mean. The Mayor’s office released a report in 2023 last year showing there was nowhere in London currently meeting the WHO’s guideline for PM2.5.
What does this data tell us about air quality in London?
Air quality has been improving in London, but the recent lowering of the guidelines by WHO shows we have much further to go to protect the health of those living, working and visiting our great city.
How can Londoner’s access the data being recorded?
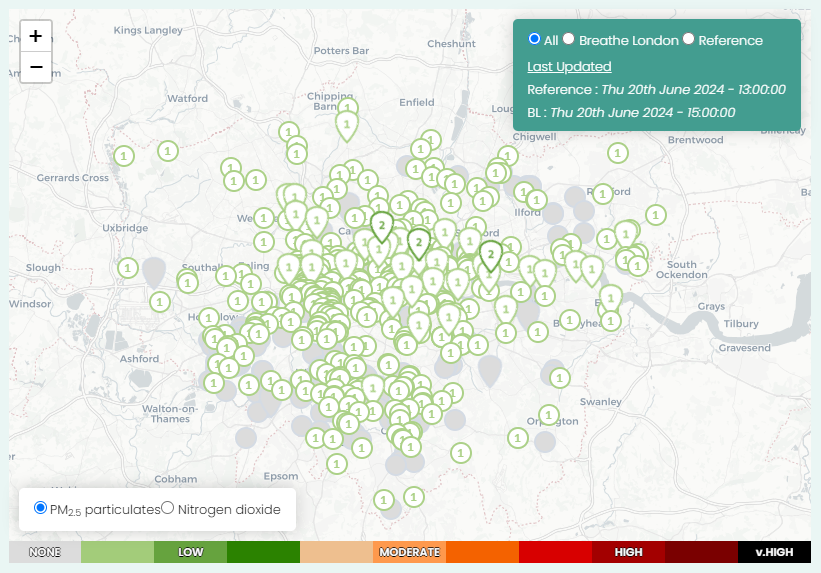
All the data from all the nodes is available on breathelondon.org. It’s updated every hour and you can plot and download data from all 300+ nodes across the city.
What has the programme achieved so far?
The programme has brought new voices into conversations and decision making around air pollution and environmental governance. It supports access to high quality, reliable air pollution data and has fostered a vibrant community of Londoners that are passionate about sharing and working with air pollution data to improve the environment for their communities.
Why is it important to have a programme like this?
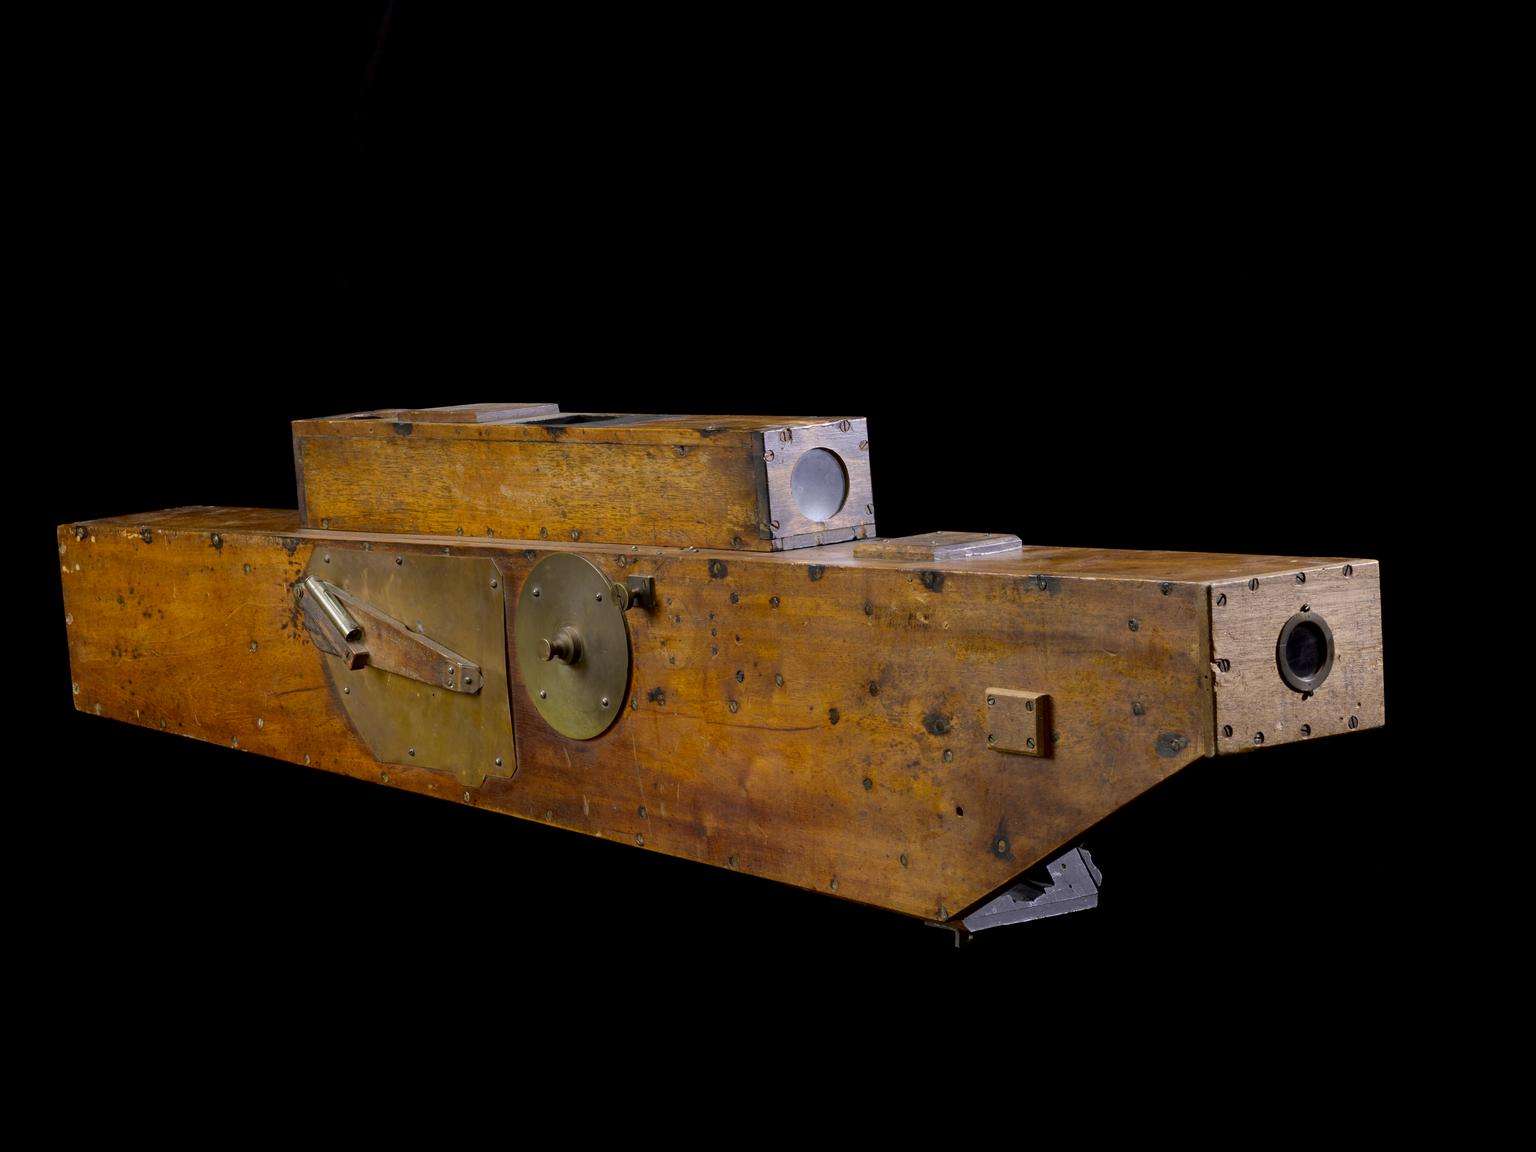
For a long time, air quality monitoring was managed by local and central government. The equipment is big and expensive so there wasn’t really a way for people to monitor air quality in their neighbourhoods.
Local authority monitoring is still vital, but a newer generation of smaller, more affordable monitors like the ones we use in the Breathe London network has opened up the possibility of involving people more directly in monitoring. Air pollution has to be tackled at both a national and local level and programmes like this can give a voice to communities to highlight local issues and solutions.
How can Londoners ensure they are not breathing in so much of these pollutants?
Whenever possible, check air pollution levels on the Breathe London website or by subscribing to an air pollution alert service like the CityAir app and plan your outdoor activities around this. This can help you find out at what times pollution is lowest outside as well as which areas have lower pollution levels.
Choosing to travel along quieter backstreets, if you can, is a great way to reduce your exposure. We did a study a few years ago comparing backstreets to main roads and found pollution was around 50% lower on backstreets.
There is a common perception that being in vehicles protects you from pollution, but the fumes from the traffic in front can mean pollution is higher inside cars. Active travel by foot and by bike actually reduces your exposure and increases your fitness levels.
We’ve seen a rise in domestic wood burning recently in London and there have been campaigns from lots of organisations to make people aware that wood burners and fire pits are becoming a serious source of pollution.
At home, regular ventilation by keeping windows open and using extractor fans whilst cooking can help improve indoor air quality. However, if you live in an area with high traffic, ensure that you open windows at times when pollution is lowest.
Is there anything notable about the data recorded at the Science Museum?
Looking at the past year’s data, there’s a noticeable spike on the 10 September 2023 when the node recorded a PM2.5 concentration of 54 ug/m3. This was actually a London-wide episode where we had high pressure for a few days combined with easterly winds. This brought pollution from Europe towards us which added to our own pollution. It’s quite unusual to have a PM2.5 particulate episode this late in the year, as we normally see them in the spring. We may start to see more episodes like this as our climate heats up.
What about other pollutants such as Ozone, Particulate Matter 10 (PM10), and sulphur dioxide. Was there a reason why these pollutants were not chosen to be measured?
These pollutants are quite difficult to measure accurately using small sensor technology. But we do measure these across London with the larger ‘reference’ equipment’. You can see data for this on londonair.org.uk.
Of these other pollutants, Ozone is definitely a pollutant of concern . Ground-level ozone is formed by the action of UV-rays on what are known as ‘precursor chemicals’ in the air. As our summers get hotter, we are likely to see more high ozone days in the years to come.
Air quality can be tracked in real time, using the US Air Quality Index (AQI) rating system. According to the AQI at the time of writing, London has an AQI of 30 and its air quality is described as “good”, but there are some who might feel the air quality isn’t good.
You’ve hit on one of the real problems we have with air quality indices currently! Like weather forecasts, most indices are for short term and categorise air pollution as ‘Low’ or ‘Good’ on that day.
But actually, we are more concerned about the health effects of air pollution over the long term, which can give a very different picture. We need to start thinking about creating longer-term indices to give people a more complete picture of air pollution in their cities.
According the AQI, one of the cities with the best air quality is Zürich, Switzerland. What can we learn from cities such as this?
Comparing cities is always tricky as each has its own pollution climate and circumstance. Back in 2015 an organization called Soot Free Cities put together a ranking of European cities and graded them on factors such as emissions reduction, promotion of public transport, regulation of construction etc. Zurich did come out on top on that analysis, but it might be different now that London has made some big improvements on nitrogen dioxide in recent years.
Can members of the public request a node be installed near them?
Yes, anyone can buy a node from the Breathe London website. The community programme has also offered free nodes to community organisations.
How can we help improve air quality in cities?
My advice is to use public and active travel wherever possible, to shop locally and to make sure your boiler is serviced and functioning well. Don’t idle when driving and try to avoid using a diesel or petrol car if you can. Don’t use wood burning stoves or firepits, as these are becoming an increasing source of particulate pollution in London.
But it’s not just the individual’s responsibility. Government and industry at both the local and international level need to promote lower emission practices.
You are also involved in the Breathe London ‘Wearables’ study, that measures London school children’s exposure to air pollution with the aim to share this data with the school community. What have the results led to?
Yes, colleagues in our Environmental Research Group at Imperial conducted this study. They found that “children who walked to and from school through busy main roads were exposed to 33% higher levels of air pollution than those who travelled through back streets” (Varaden et al 2021).
As a results of being involved in the study, parents and children changed the way they travelled to and from school, with a big drop in driving and an increase in walking and scooting. The results have paved the way for another study called ‘Wellhome’, which is focused on understanding indoor air quality conditions throughout different London homes.
The air quality node installed outside the Science Museum is part of a network of cultural institutions who also have nodes outside their buildings. Can you tell us more about this?
Like so many of our toughest challenges, tackling air pollution requires collective action and collaboration. In London, we’re fortunate enough to work alongside a phenomenal range of cultural institutions that attract millions of visitors from across the global each year – from people interested in history and culture, to those keen to experience world leading art. So far, nodes have been installed at Royal Botanic Gardens Kew, Serpentine, Imperial War Museum, National Gallery as well as the Science Museum.
The community programme is supported by Bloomberg Philanthropies, who works closely with these institutions, as well as a vast network of environmental and cultural partners globally. By collaborating with Bloomberg Philanthropies, cultural institutions, community groups, and other partners, we can generate richer data, develop better informed insights, and tell a more holistic story to support concerted action on air pollution.
What can we expect from the Breathe London network this year?
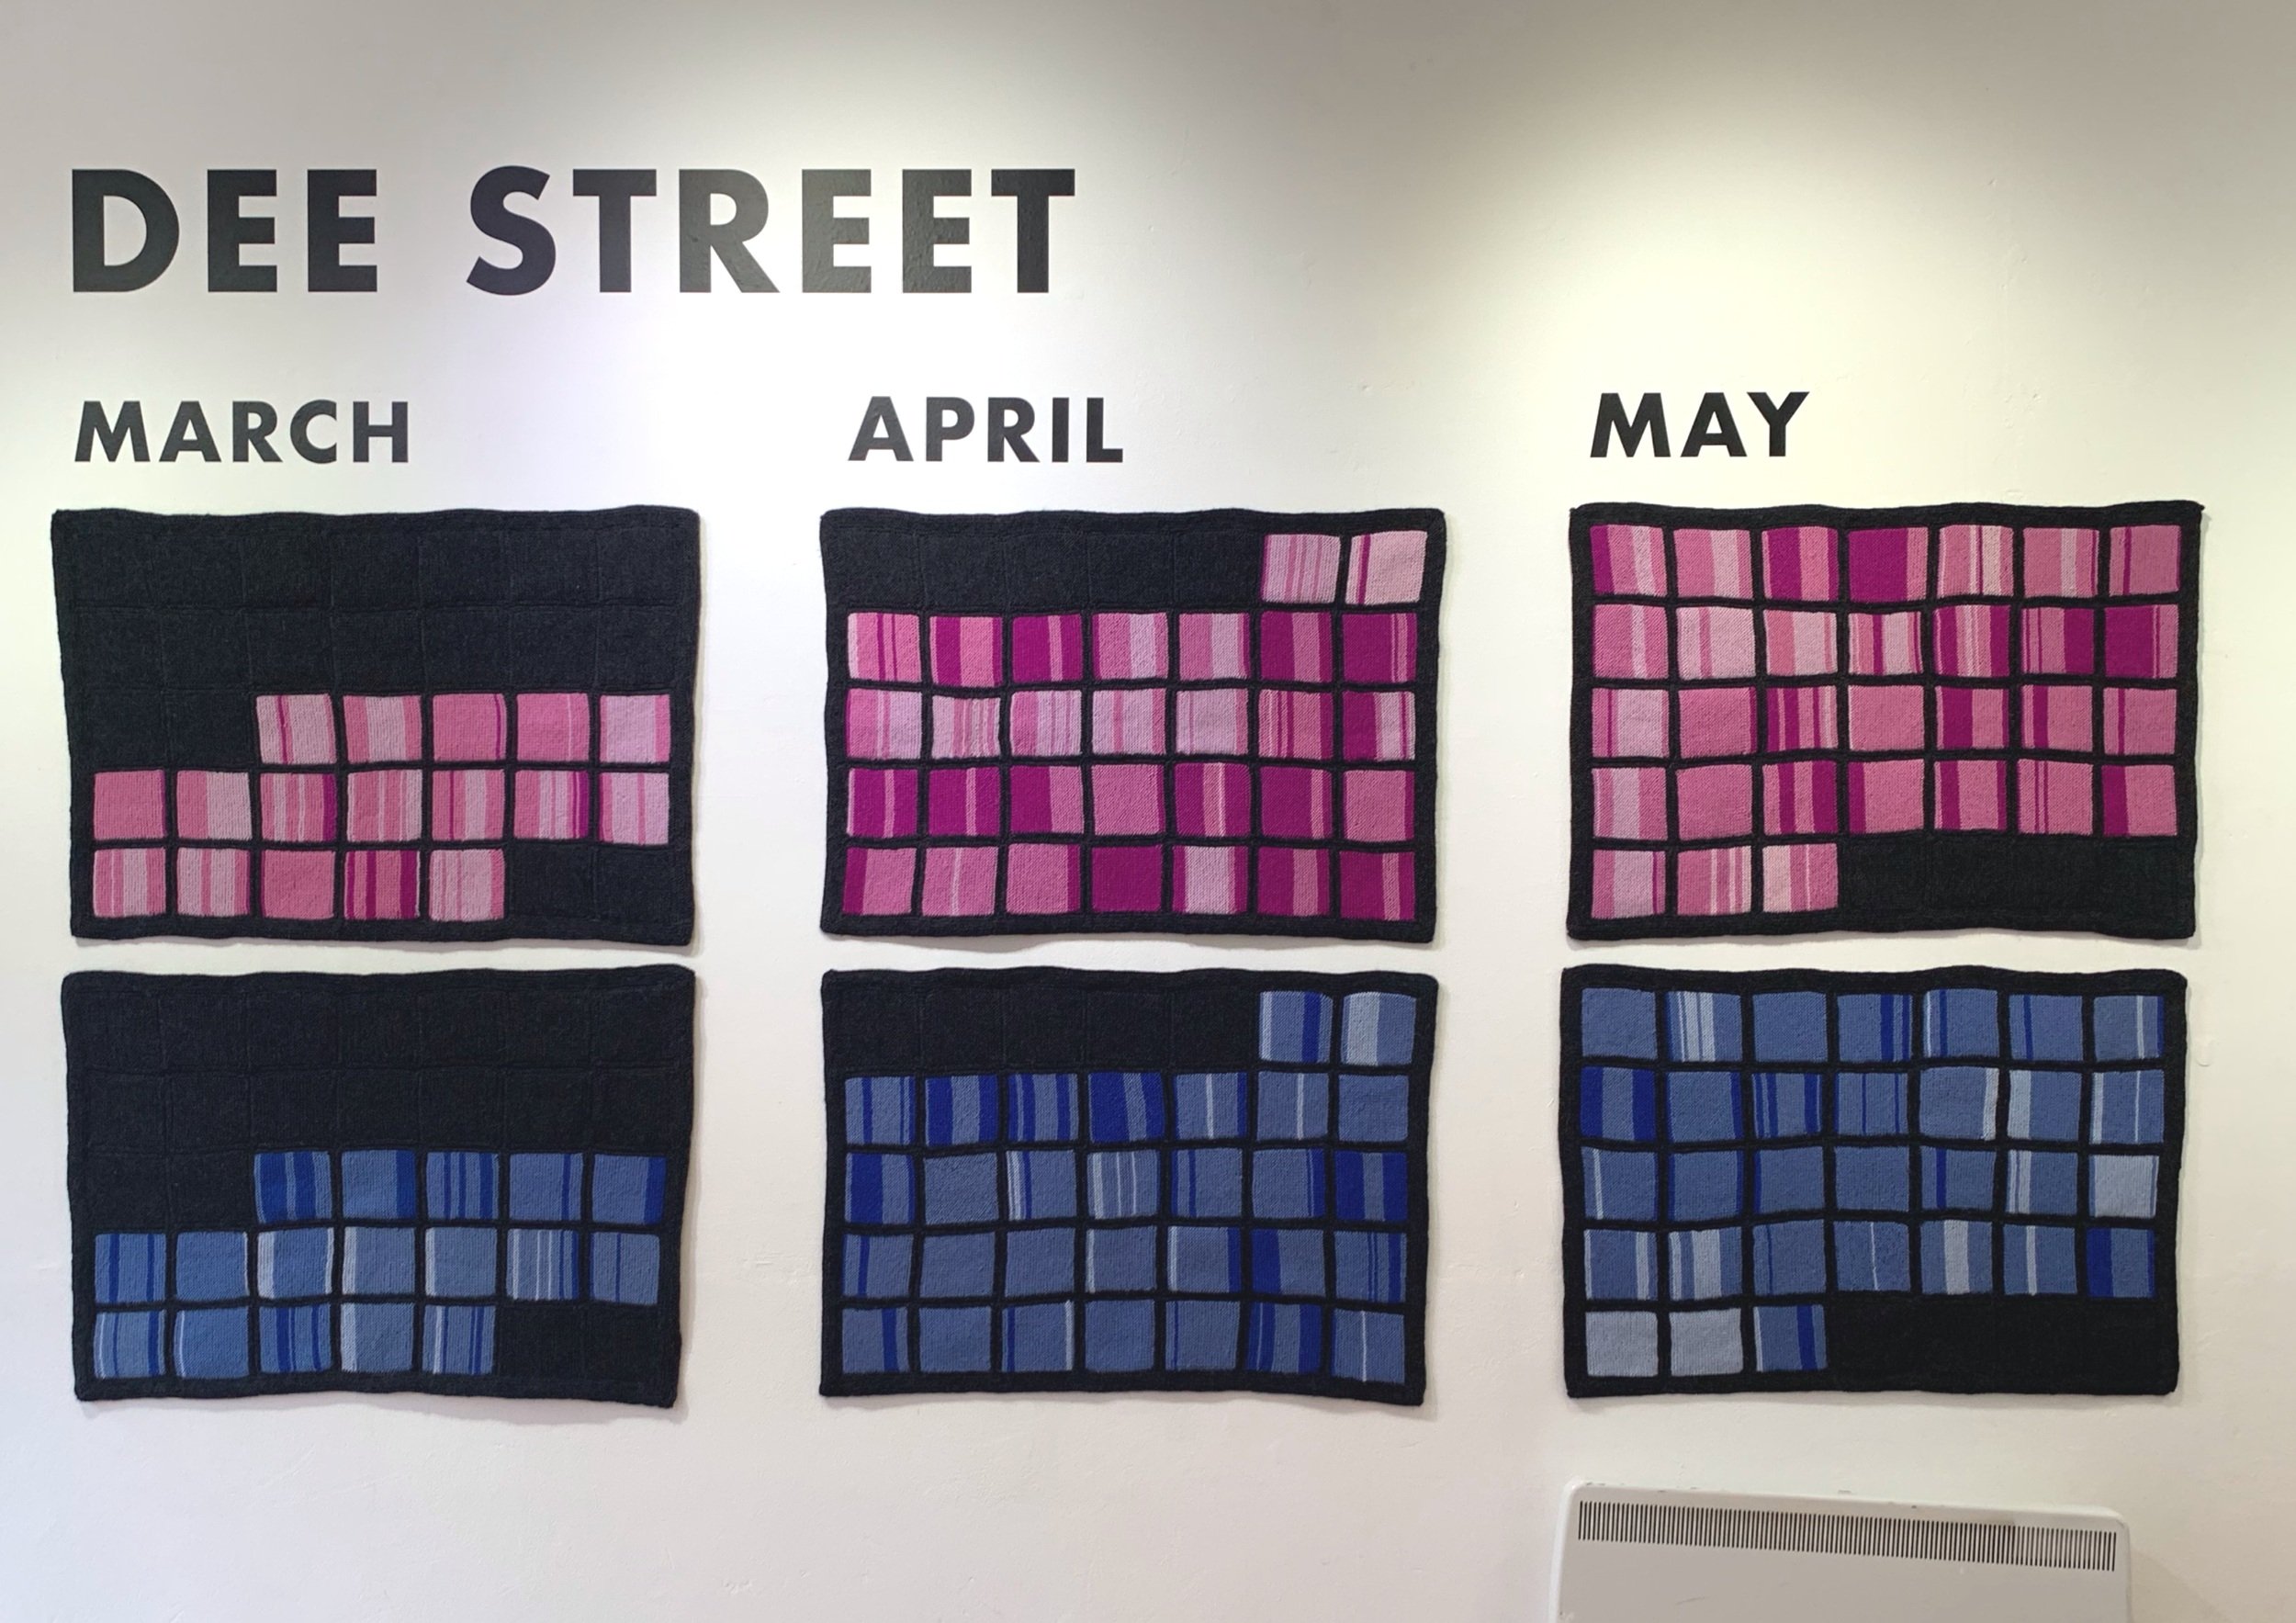
We are planning to host the ‘Knitting the Air’ exhibition, which features a unique textile artwork created by a collective of over 70 east London community knitters to visually illustrate air quality data in Tower Hamlets over 12 months. Using blue to represent Nitrogen Dioxide and pink for Particulate Matter 2.5. The final piece will showcase 1460 squares to show the levels of these different pollutants each day.
We are also working towards building connections with our cultural partners to draw attention to the node data and raise awareness about air quality. We are interested in exploring the evolution and history of air quality sensing devices with the Science Museum, as well as the importance of trees in acting as biological filters to remove particulate matter pollution in urban areas at Royal Botanical Gardens Kew.
For more on Clean Air Day, visit actionforcleanair.org.uk/campaigns/clean-air-day